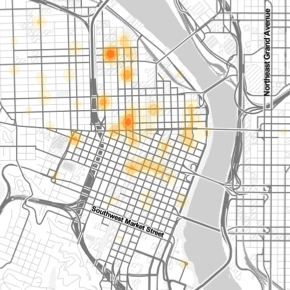
'cRaggy' BIKETOWN Data Viz
Using ggmap to visualize BIKETOWN bike share system data

Crash Data Dashboard
A Tableau dashboard to explore traffic crashes in Southern Oregon

SOTU Wordcloud Shiny App
A Shiny app to interactively explore State of the Union Addresses
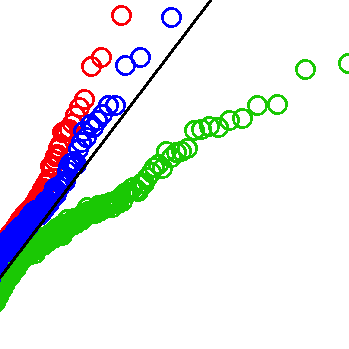
Bridge Crossing Analysis
An exercise to determine the more reliable transit route alignment
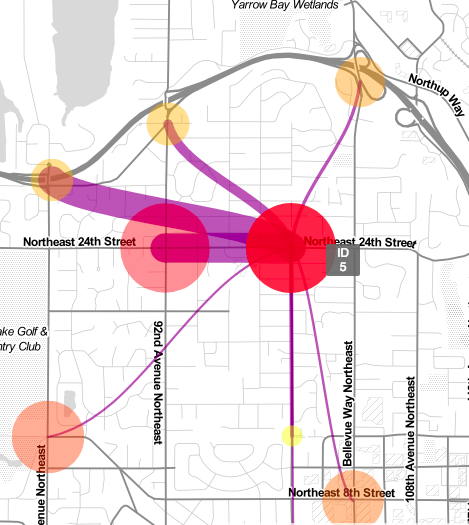
Spatial Sankey Map
A tool to visually explore origin-destination data
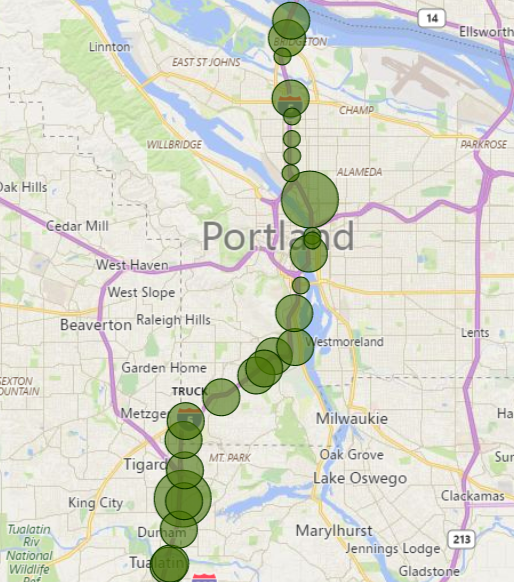
Portal Data Quality Checking
Tidying and wrangling a large dataset, then detecting data quality issues.
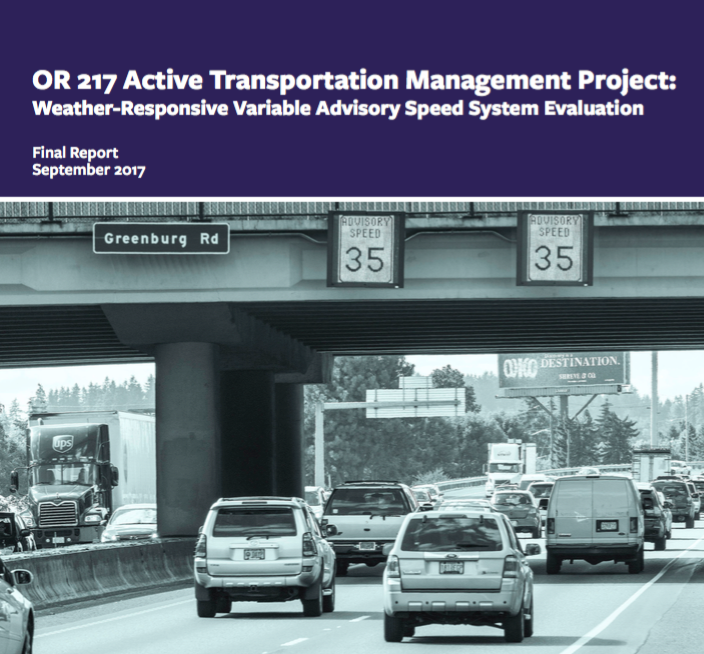
OR 217 Evaluation
Before/after study to evaluate performance of weather system on one of the Portland region's busiest highways.
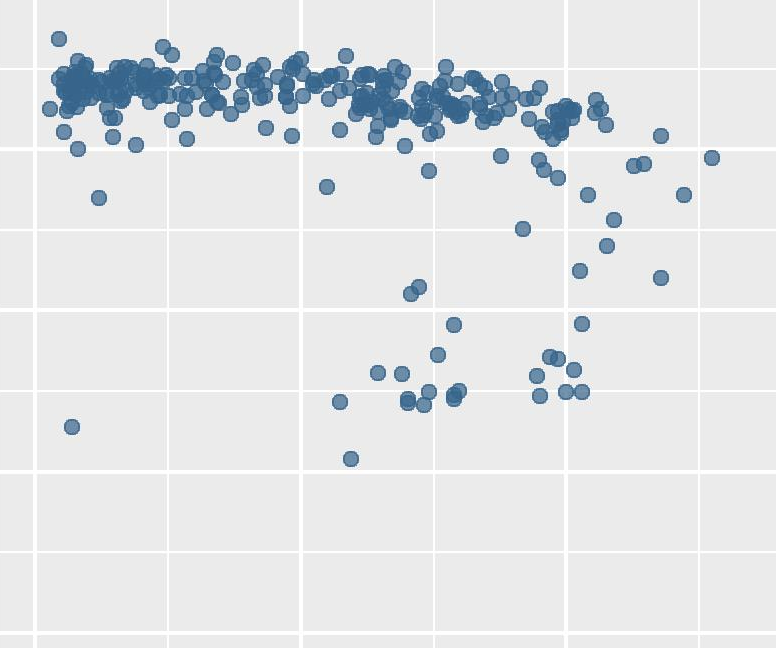
2017 Solar Eclipse
Exploring travel patterns around the 2017 solar eclipse with Portal data.